ADI Choropleth NC
Visualizing ADI Score in NC
Reading in the data
# read in and save the census block groups for the 5 counties to look at..
# Alamance 37001
# Forsyth 37067
# Guilford 37081
# Randolph 37151
# Rockingham 37157
Counties <- c("37001", "37067", "37081", "37151", "37157")
# NC_bg <- block_groups(state = "NC", county = c("001", "067", "081", "151", "157"), cb = FALSE)
# saveRDS(NC_bg, here::here("data", "NC_blockgroups.rds"))
NC_bg <- readRDS(here::here("content", "post", "2020-04-26-adi-NC", "NC_blockgroups.rds"))
ADI <- read_csv(here::here("content", "post", "2020-04-26-adi-NC", "NC_blockgroup_15.txt")) %>%
mutate(fips_char = as.character(fips))## Parsed with column specification:
## cols(
## gisjoin = col_character(),
## fips = col_double(),
## adi_natrank = col_double(),
## adi_staternk = col_double()
## )## Warning: 336 parsing failures.
## row col expected actual file
## 5988 adi_natrank a double GQ 'C:/Users/philw/Desktop/my-site/content/post/2020-04-26-adi-NC/NC_blockgroup_15.txt'
## 5988 adi_staternk a double GQ 'C:/Users/philw/Desktop/my-site/content/post/2020-04-26-adi-NC/NC_blockgroup_15.txt'
## 5989 adi_natrank a double GQ 'C:/Users/philw/Desktop/my-site/content/post/2020-04-26-adi-NC/NC_blockgroup_15.txt'
## 5989 adi_staternk a double GQ 'C:/Users/philw/Desktop/my-site/content/post/2020-04-26-adi-NC/NC_blockgroup_15.txt'
## 5990 adi_natrank a double GQ 'C:/Users/philw/Desktop/my-site/content/post/2020-04-26-adi-NC/NC_blockgroup_15.txt'
## .... ............ ........ ...... ....................................................................................
## See problems(...) for more details.Data cleaning
ADI_filter <-
ADI %>%
filter(str_detect(fips, Counties))
BL_ADI <- geo_join(NC_bg, ADI, 'GEOID', 'fips_char', how = 'left')
# Distribution of the population per country?
BL_ADI@data %>%
ggplot( aes(x=as.numeric(adi_staternk))) +
geom_bar(bins=20, fill='#69b3a2', color='white') +
xlab("ADI State Rank") +
scale_x_continuous(breaks = seq(0,10,1), labels = seq(0,10,1)) +
theme_bw() ## Warning: Ignoring unknown parameters: bins## Warning: Removed 16 rows containing non-finite values (stat_count).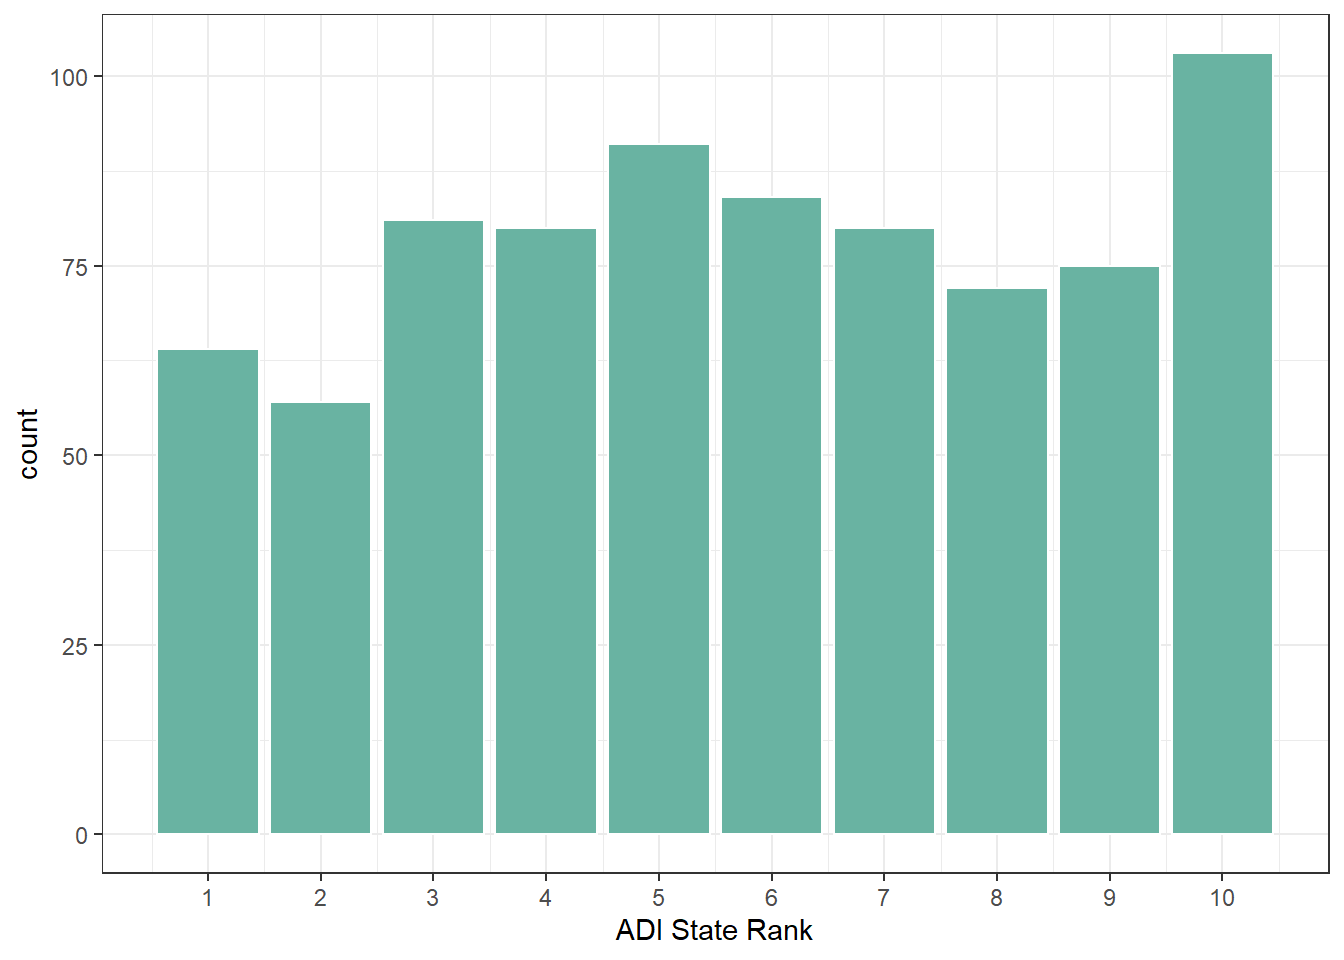
# Read in population data from ACS dataset
bg_pop <- readRDS(here::here("content", "post", "2020-04-26-adi-NC", "ACS_PopEst.rds"))
# Join to spatial dataframe that currently exists
BL_ADI_POP <- geo_join(BL_ADI, bg_pop, 'GEOID', 'GEOID', how = 'left')
# head(BL_ADI_POP$estimate)
BL_ADI_POP@data %>%
ggplot( aes(estimate)) +
geom_histogram(bins = 10) +
xlab("Population Estimate") +
# scale_x_continuous(breaks = seq(0,10,1), labels = seq(0,10,1)) +
theme_bw() 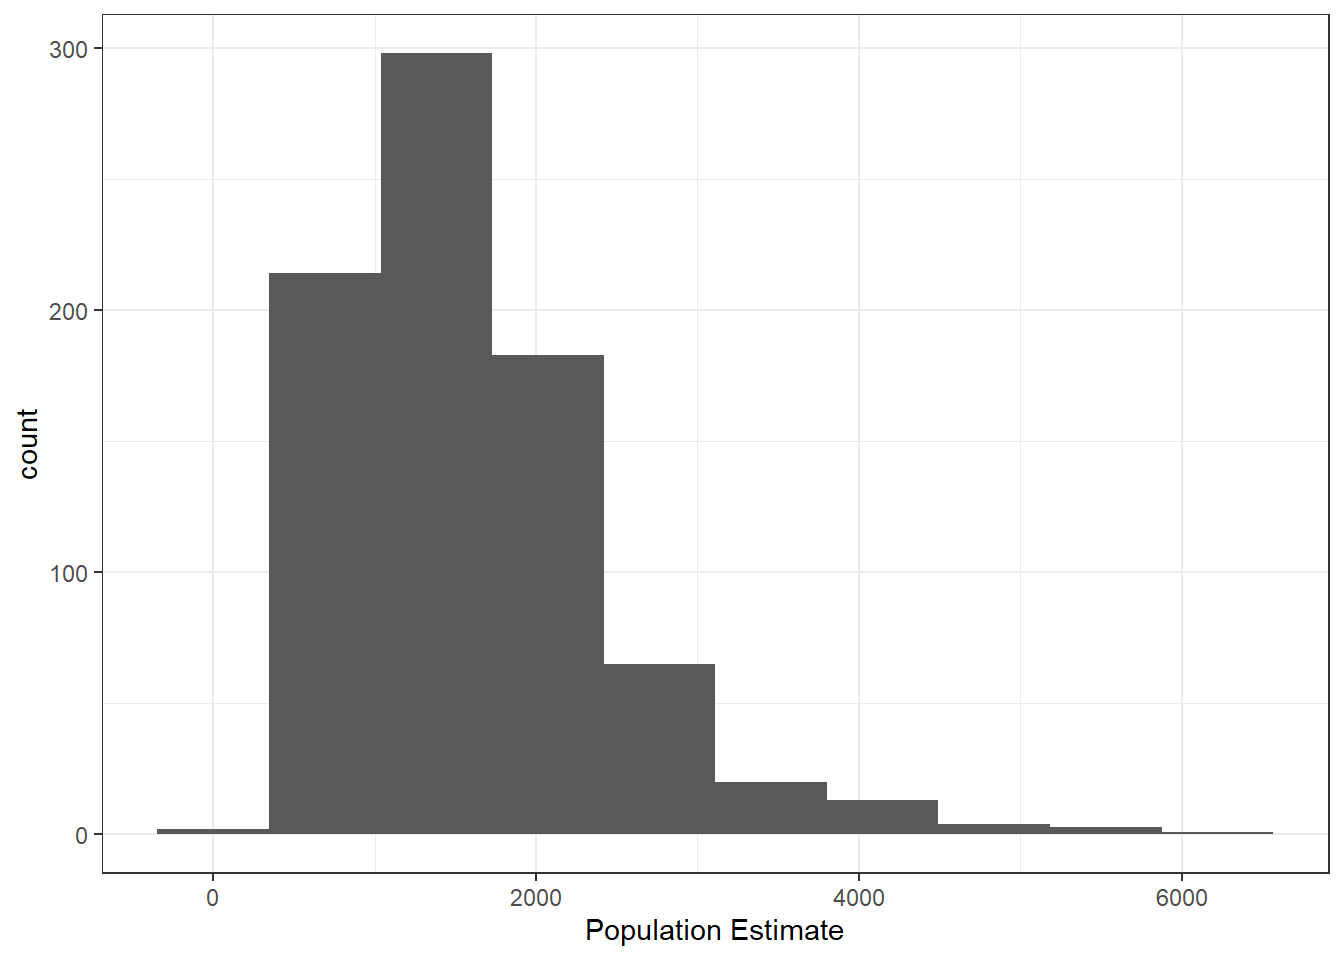
Make a map
pal <- colorNumeric("Greens", domain=BL_ADI$adi_staternk)
# Setting up the pop up text
popup_sb <- paste0("ADI State Rank: ", as.character(BL_ADI$adi_staternk))
popup_sb <- paste(
"ADI State Rank: ", BL_ADI@data$adi_staternk,"<br/>",
"County: ", BL_ADI@data$COUNTYFP, "<br/>",
"Block Group: ", BL_ADI@data$NAMELSAD,
sep="") %>%
lapply(htmltools::HTML)
qpal <- colorQuantile("Blues", BL_ADI_POP@data$estimate, n = 7)
POPpal <- colorNumeric(
palette = "YlGnBu",
domain = BL_ADI_POP@data$estimate
)
popupADI <- paste("<strong>", BL_ADI_POP@data$County, "</strong>",
"<br/>",
"Tract: ", BL_ADI_POP@data$Tract,
"<br/>",
"Block Group: ", BL_ADI_POP@data$BG,
"<br/>",
"ADI Rank: ", BL_ADI_POP@data$adi_staternk,
"<br/>",
"Population: ", BL_ADI_POP@data$estimate,
sep="") %>%
lapply(htmltools::HTML)
popupPOP <- paste("<strong>", BL_ADI_POP@data$County, "</strong>",
"<br/>",
"Tract: ", BL_ADI_POP@data$Tract,
"<br/>",
"Block Group: ", BL_ADI_POP@data$BG,
"<br/>",
"ADI Rank: ", BL_ADI_POP@data$adi_staternk,
"<br/>",
"Population: ", BL_ADI_POP@data$estimate,
sep="") %>%
lapply(htmltools::HTML)
leaflet(BL_ADI_POP) %>%
addTiles() %>%
addPolygons(label = ~popupADI,
group = "ADI Rank",
fillColor = ~pal(adi_staternk),
color = "#444444",
weight = 1,
smoothFactor = 0.5,
opacity = 1.0,
fillOpacity = 0.5,
highlightOptions = highlightOptions(color = "white",
weight = 2,
bringToFront = TRUE),
labelOptions = labelOptions(
style = list("font-weight" = "normal", padding = "3px 8px"),
textsize = "15px",
direction = "auto")) %>%
addPolygons(label = ~popupPOP,
group = "Population",
fillColor = ~POPpal(estimate),
color = "#444444",
weight = 1,
smoothFactor = 0.5,
opacity = 1.0,
fillOpacity = 0.5,
highlightOptions = highlightOptions(color = "white",
weight = 2,
bringToFront = TRUE),
labelOptions = labelOptions(
style = list("font-weight" = "normal", padding = "3px 8px"),
textsize = "15px",
direction = "auto")) %>%
addLegend(pal = pal,
values = ~adi_staternk,
opacity = 0.7,
title = NULL,
position = "bottomright",
group = "ADI Rank") %>%
addLegend(pal = POPpal,
values = ~estimate,
opacity = 0.7,
title = NULL,
position = "bottomright",
group = "Population") %>%
addLayersControl(overlayGroups = c("ADI Rank", "Population"),
options = layersControlOptions(collapsed = FALSE)) Phil Walker
Data Analytics Consultant
I am interested with collabations which drive improvements in the daily lives of others matter.